

Social Media Compensation Survey Results
Over 1,000 people filled out a compensation survey. Here’s what it tells us.

A little over a month ago, I sent out an anonymous survey for people to fill in information about their compensation within the field of social media. And I want to thank every single person who took the time to submit. I have received numerous DMs from people saying that seeing the range of salaries helped them realize their worth and negotiate a higher salary. Oh, and contrary to the belief that "the intern" runs social media at most major companies, only two interns completed the compensation survey.
None of this would have been possible without the sheer amount of data that was entered—and there was a lot. So I worked with Anne Gale (check out her LinkedIn here!), a person who looks at numbers for a living, to digest some of the information. Below you’ll find graphs and analysis related to the numbers from the survey. The goal of this is to create more transparency around salaries, make sure people are getting paid their worth, and understand some of the factors that lead to high or low salaries. Let’s dive into it.
First, I want to just give some transparency into how the data was cleaned in preparation for analysis. While open-ended answers are helpful for the sake of accuracy, they make it a little difficult to create graphs based on trends. So before analyzing this data, we went through and standardized some of the answers. This meant we removed any answers that were not from the U.S. (since it’s a compensation survey, it was important for it all to be USD) or were incomplete. We also had to standardize the job titles—your exact role might not be on there but there will most likely be an option that loosely matches up. We only included salaries that were inputted as annual (as opposed to hourly) for consistency and also removed any outliers (extreme high and low salaries). I removed any job titles that were not directly within organic social media, namely Paid Social, since I really do think of that as a separate skill set. Other than that, most answers should more or less look like what was originally filled out. Okay, now let’s actually dive in.
GENDER IDENTITY

Those who identify as male earn a higher mean (average) salary than those who identify as women by over $7,000. While there were no statistically significant differences looking at the role titles attained by males and females, a possible explanation would be that both men and women hold leadership positions but men get paid more in those roles. Also, consistent with existing research, non-binary people earn less than people identifying as male or female.
RACIAL IDENTITY

Income is generally similar between racial groups. None of the differences reported here are statistically significant at the 95% confidence level.
AGE

Income generally increases with age.
ROLE TITLE

The dot and middle number represents the mean salary for the aligning title. The purple bar represents the middle 50% of salaries. The lower number for each range is the 25% percentile of salaries and the higher number in the range is the 75% percentile of salaries.
I think it’s interesting to note the large range in salary for Social Media Consultants/Freelancers. As you’ll see later on, your salary is partially dictated by the kind of company you work for (industry, size, etc). Once you remove some of those restrictions, it appears there is greater earning potential.
TIME IN ROLE + TIME WORKING IN SOCIAL MEDIA


Time spent in social media is the single biggest predictor of salary out of all the questions included in the survey. Time spent in your current role isn't a good predictor of salary, which could mean that switching jobs is a good way to increase your salary. Also shout out to whoever has been in social for 15+ years.
SALARY RANGES BY YEARS OF EXPERIENCE

The dot and middle number represents the mean salary for the aligning years of experience. The purple bar represents the middle 50% of salaries. The lower number for each range is the 25% percentile of salaries and the higher number in the range is the 75% percentile of salaries.
PLANS TO MAKE A CAREER IN SOCIAL
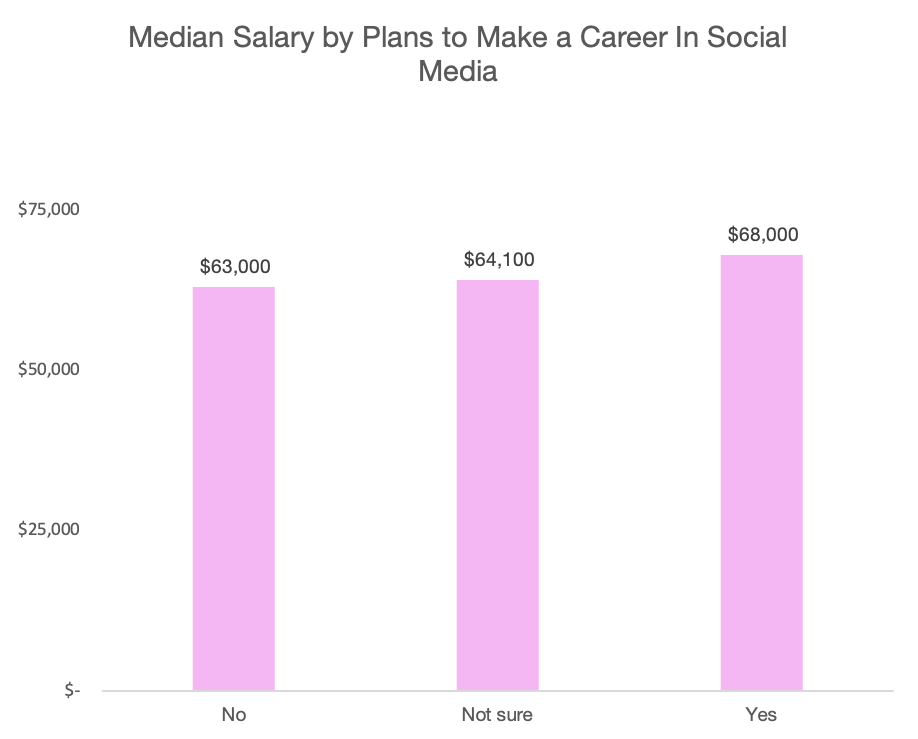
People who plan to make a career in social media earn significantly more than people who do not plan or are unsure about making a career in social. This could either point to people who are fully invested in social media rising faster, or that social media only seems like a viable career once you start earning a certain amount.
People who plan to make a career in social are more likely to be female, Hispanic or Latinx, and slightly older than people who do not plan to make a career or are unsure.
COMPANY ATTRIBUTES


People at larger companies tend to earn higher salaries than those at smaller companies. Also important to note that people at for-profit organizations earn significantly more than people at non-profits and public sector organizations. While this is likely a result of low pay across the board in non-profit jobs, in a study by Payscale you can see that people who work within marketing in non-profits take the biggest pay cut when compared to people in the same types of roles at for-profits.
SALARY BY INDUSTRY

Technology, healthcare, and entertainment are the highest paying industries. A few things to note: organizations in these industries tend to be large, leaving room for bigger teams, advancement opportunities, and higher paying roles. Another thing to note is that the most popular industry in the results was “Agency”, making up 18% of the sample. It’s also the fifth lowest paying industry.
NEGOTIATION STATUS

People who successfully negotiated their salary earn higher average wages than people who didn't attempt to negotiate, negotiated unsuccessfully, or didn't answer this survey question. People who successfully negotiated their salaries were more likely to have 5+ years of experience in social media.
FINAL NOTE
This newsletter was meant to help digest the raw data, but it’s still a lot to process. I think the biggest takeaway for me was that social media jobs continue to be underpaid and undervalued when compared to other jobs within marketing. According to the U.S. Bureau of Labor Statistics’ Occupational Outlook Handbook for 2020, the median salary for a Marketing Manager is $141,490—compare that to a Social Media Manager (a role not even represented in the handbook) which this survey says has a median salary is $63,000. Even if you look at the highest paying social roles entered in this survey (those with Senior Director, SVP, or VP in their title), you’ll find the median salary is $123,500.
This comparison makes it clear that social media professionals are still not valued the same way their traditional marketing counterparts are. But social media professionals often provide invaluable consumer insights, smart copywriting, large-scale campaign strategy, product photography, and so much more—all on top of the day-to-day organic social posting. Until social media professionals are properly invested in at a company-wide level, I worry we’ll see retention rates dwindle and talented people exit the field entirely. How do we make sure the 41% of respondents to this survey who said they weren’t sure if they want to make a career in social media know that there’s a career to be had in the first place?
Finally, the survey is now closed, but you can always find the survey responses here. I plan to conduct a new one each year. I hope you’re able to use this data to either bring your salary up to where it should be or negotiate one that better reflects your worth. Thank you all again for filling it out!
2023 = still helpful
Thank you!
This is great information! Thank you for sharing :)